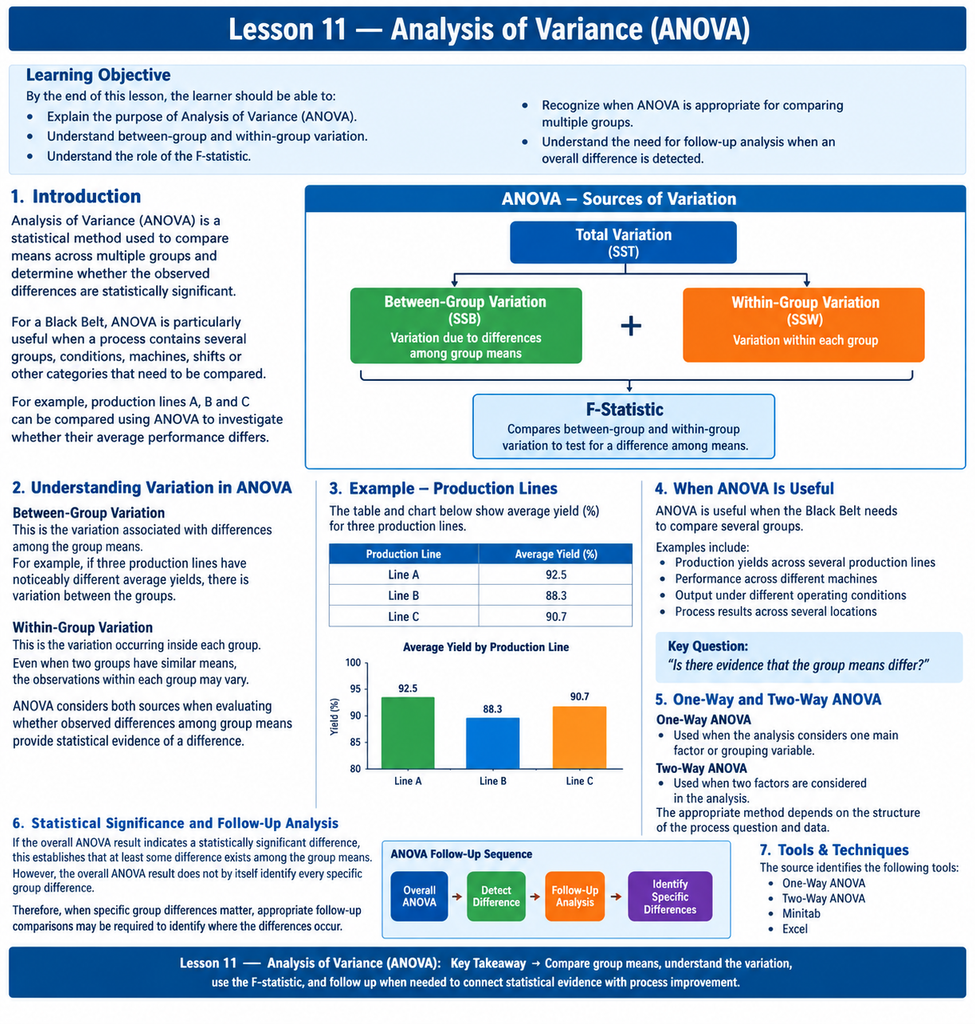
Analysis of Variance (ANOVA)
Learning Objective
By the end of this lesson, the learner should be able to:
- Explain the purpose of Analysis of Variance (ANOVA).
- Understand between-group and within-group variation.
- Understand the role of the F-statistic.
- Recognize when ANOVA is appropriate for comparing multiple groups.
- Understand the need for follow-up analysis when an overall difference is detected.
1. Introduction
Analysis of Variance (ANOVA) is a statistical method used to compare means across multiple groups and determine whether the observed differences are statistically significant.
For a Black Belt, ANOVA is particularly useful when a process contains several groups, conditions, machines, shifts or other categories that need to be compared.
For example:
- Production Line A
- Production Line B
- Production Line C
The Black Belt can use ANOVA to investigate whether their average performance differs.
2. Understanding Variation in ANOVA
ANOVA examines variation from two important sources.
Between-Group Variation
This is the variation associated with differences among the group means.
For example, if three production lines have noticeably different average yields, there is variation between the groups.
Within-Group Variation
This is the variation occurring inside each individual group.
Even when two groups have similar means, the observations within each group may vary.
ANOVA considers both sources when evaluating whether observed differences among group means provide statistical evidence of a difference.
3. The F-Statistic
The F-statistic compares the relevant sources of variation in ANOVA.
Conceptually, ANOVA asks whether the variation between group means is sufficiently large relative to the variation occurring within the groups.
Evidence of differencePlotTable
PlotTable
Mean spacing
Mean spacing
Within spread
Within spread
Drag a dot to test one observation · Generate data makes another simulated dataset
Give feedback
A large relative difference between these sources of variation can provide evidence that the group means are not all the same under the selected ANOVA model and assumptions.
4. When ANOVA Is Useful
ANOVA is useful when the Black Belt needs to compare several groups.
Examples include:
- Production yields across several production lines
- Performance across different machines
- Output under different operating conditions
- Process results across several locations
The key question is:
“Is there evidence that the group means differ?”
5. One-Way and Two-Way ANOVA
The source identifies:
One-Way ANOVA
Used when the analysis considers one main factor or grouping variable.
Two-Way ANOVA
Used when two factors are considered in the analysis.
The appropriate method depends on the structure of the process question and data.
6. Statistical Significance and Follow-Up Analysis
If the overall ANOVA result indicates a statistically significant difference, this establishes that at least some difference exists among the group means.
However, the overall ANOVA result does not by itself identify every specific group difference.
Therefore, when specific group differences matter, appropriate follow-up comparisons may be required to identify where the differences occur.
This creates an important Black Belt sequence:
Overall ANOVA → Detect Difference → Follow-Up Analysis → Identify Specific Differences
7. Tools & Techniques
The source identifies the following tools:
- One-Way ANOVA
- Two-Way ANOVA
- Minitab
- Excel
These tools support the statistical analysis and interpretation of differences among groups.
8. Application Example
Comparing Production Lines
A manufacturing company wants to compare production yield across three production lines:
- Line A
- Line B
- Line C
The Black Belt collects yield data from the three lines and uses ANOVA to determine whether the observed differences in average yield provide statistical evidence of a difference.
If the overall result indicates a difference, the Black Belt can conduct appropriate follow-up analysis to investigate which groups differ.
9. Case Study
Pharmaceutical Tablet Presses
A pharmaceutical company compared the performance of three tablet presses.
ANOVA identified one press with lower yield.
The organisation investigated the identified equipment and carried out:
- Maintenance
- Recalibration
Following these actions, overall yield increased by 8%.
Black Belt Learning
The case demonstrates how ANOVA can help identify differences among multiple process groups and direct attention toward an area requiring further investigation.
The statistical result is therefore connected to practical process improvement.
10. Black Belt Perspective
A Black Belt should think beyond simply obtaining an ANOVA p-value.
The important questions are:
- What groups are being compared?
- How much variation exists within each group?
- How much variation exists between groups?
- Does the overall analysis indicate evidence of a difference?
- If a difference exists, where does it occur?
- What process investigation should follow?
The objective is to connect statistical evidence with process understanding.
11. Lesson Practice
- What question does ANOVA answer?
- What is meant by between-group variation?
- What is meant by within-group variation?
- What role does the F-statistic play in ANOVA?
- Why is within-group variation important?
- What should happen after a significant multi-group result when specific group differences matter?
- Give one example of a process situation where ANOVA could be useful.
12. Key Learning Points
- ANOVA compares means across multiple groups.
- Between-group variation relates to differences among group means.
- Within-group variation occurs inside the groups.
- The F-statistic compares relevant sources of variation.
- One-way and two-way ANOVA are identified as relevant methods.
- Minitab and Excel can support ANOVA analysis.
- A significant overall result may require appropriate follow-up comparisons.
- Statistical analysis should be connected to process investigation and improvement.
13. Lesson Conclusion
Analysis of Variance provides the Black Belt with a structured method for evaluating differences among multiple groups.
The essential sequence is:
Define Groups → Examine Variation → Perform ANOVA → Evaluate Evidence → Follow Up Where Needed → Investigate the Process